|
-
February 7th, 2009, 01:56 AM
#1
 CWGraph (NI Measurement Studio) question CWGraph (NI Measurement Studio) question
Colleagues,
Does anyone know how to scroll the CWGraph control? Here's the behavior I want to achieve:
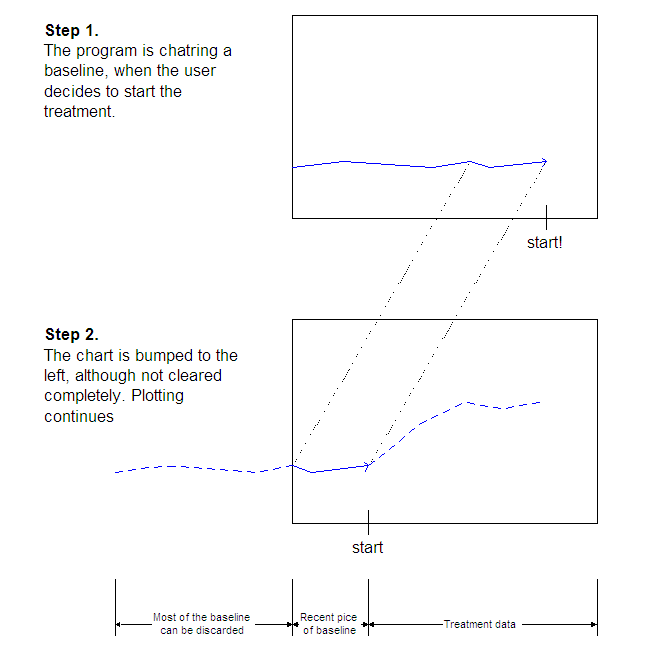
1. The graph's X axis spans from 0 to 3000. In the beginning, it's charting a baseline (using ChartY method).
2. Let's say, it charted to 2500, when the user initiates a certain activity of interest.
3. Graph immediately scrolls left leaving only the last 500 points of the baseline (this is the part I don't know how to do). The rest can be discarded.
4. Plotting continues from 500 onward.
Could anybody give me some suggestions?
Thanks,
- Nick
P.S.
- VB6 and Measurement Studio 8.1.11.
- I'm aware that NI has it's own forum.
Below is the same behavior on a storyboard:
Tags for this Thread
 Posting Permissions
- You may not post new threads
- You may not post replies
- You may not post attachments
- You may not edit your posts
-
Forum Rules
|
Click Here to Expand Forum to Full Width
|


 Reply With Quote